


Census Tract 9587, Brookings County, South Dakota
About
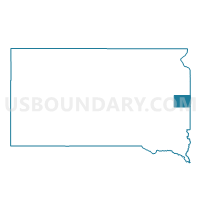
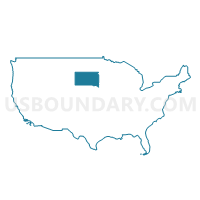
Outline

Summary
| Unique Area Identifier | 491560 |
| Name | Census Tract 9587 |
| County | Brookings County |
| State | South Dakota |
| Area (square miles) | 409.17 |
| Land Area (square miles) | 399.04 |
| Water Area (square miles) | 10.14 |
| % of Land Area | 97.52 |
| % of Water Area | 2.48 |
| Latitude of the Internal Point | 44.37688340 |
| Longtitude of the Internal Point | -96.95784370 |
| Total Population | 4,965 |
| Total Housing Units | 2,346 |
| Total Households | 2,017 |
| Median Age | 39.7 |
Maps

Graphs
Select a template below for downloading or customizing gragh for Census Tract 9587, Brookings County, South Dakota


Neighbors
Neighoring Census Tract (by Name) Neighboring Census Tract on the Map
- Census Tract 9536, Deuel County, SD
- Census Tract 9551, Hamlin County, SD
- Census Tract 9552, Hamlin County, SD
- Census Tract 9581, Kingsbury County, SD
- Census Tract 9586, Brookings County, SD
- Census Tract 9588.02, Brookings County, SD
- Census Tract 9588.03, Brookings County, SD
- Census Tract 9589, Brookings County, SD
- Census Tract 9590, Brookings County, SD
- Census Tract 9596, Moody County, SD
- Census Tract 9601, Lake County, SD
Top 10 Neighboring County Subdivision (by Population) Neighboring County Subdivision on the Map
- Volga city, Brookings County, SD (1,768)
- Medary township, Brookings County, SD (1,427)
- Arlington city, Kingsbury County, SD (907)
- Norden township, Hamlin County, SD (511)
- Brookings township, Brookings County, SD (431)
- Volga township, Brookings County, SD (383)
- Sterling township, Brookings County, SD (378)
- Estelline township, Hamlin County, SD (324)
- Aurora township, Brookings County, SD (294)
- Spring Lake township, Kingsbury County, SD (290)
Top 10 Neighboring Place (by Population) Neighboring Place on the Map
- Volga city, SD (1,768)
- Arlington city, SD (915)
- Lake Poinsett CDP, SD (493)
- Bruce city, SD (204)
- Sinai town, SD (120)
Top 10 Neighboring Unified School District (by Population) Neighboring Unified School District on the Map
- Brookings School District 05-1, SD (25,450)
- Sioux Valley School District 05-5, SD (3,325)
- Hamlin School District 28-3, SD (3,314)
- Arlington School District 38-1, SD (1,915)
- Deubrook School District 05-6, SD (1,902)
- Estelline School District 28-2, SD (1,589)
- Oldham-Ramona School District 39-5, SD (875)
- Rutland School District 39-4, SD (578)
Top 10 Neighboring State Legislative District Lower Chamber (by Population) Neighboring State Legislative District Lower Chamber on the Map
- State House District 7, SD (24,910)
- State House District 8, SD (20,647)
- State House District 4, SD (20,558)
- State House District 6, SD (19,896)
Top 10 Neighboring State Legislative District Upper Chamber (by Population) Neighboring State Legislative District Upper Chamber on the Map
- State Senate District 7, SD (24,910)
- State Senate District 8, SD (20,647)
- State Senate District 4, SD (20,558)
- State Senate District 6, SD (19,896)
Top 10 Neighboring 111th Congressional District (by Population) Neighboring 111th Congressional District on the Map
Top 10 Neighboring 5-Digit ZIP Code Tabulation Area (by Population) Neighboring 5-Digit ZIP Code Tabulation Area on the Map
- 57006, SD (24,530)
- 57071, SD (2,758)
- 57212, SD (2,062)
- 57234, SD (1,274)
- 57276, SD (1,178)
- 57248, SD (1,057)
- 57220, SD (767)
- 57054, SD (502)
- 57268, SD (443)
- 57050, SD (191)
Data
Demographic, Population, Households, and Housing Units
** Data sources from census 2010 **
Show Data on Map
Download Full List as CSV
Download Quick Sheet as CSV
| Subject | This Area | Brookings County | South Dakota | National |
|---|---|---|---|---|
| POPULATION | ||||
| Total Population Map | 4,965 | 31,965 | 814,180 | 308,745,538 |
| POPULATION, HISPANIC OR LATINO ORIGIN | ||||
| Not Hispanic or Latino Map | 4,876 | 31,329 | 792,061 | 258,267,944 |
| Hispanic or Latino Map | 89 | 636 | 22,119 | 50,477,594 |
| POPULATION, RACE | ||||
| White alone Map | 4,841 | 29,802 | 699,392 | 223,553,265 |
| Black or African American alone Map | 9 | 254 | 10,207 | 38,929,319 |
| American Indian and Alaska Native alone Map | 30 | 282 | 71,817 | 2,932,248 |
| Asian alone Map | 22 | 869 | 7,610 | 14,674,252 |
| Native Hawaiian and Other Pacific Islander alone Map | 1 | 9 | 394 | 540,013 |
| Some Other Race alone Map | 22 | 295 | 7,477 | 19,107,368 |
| Two or More Races Map | 40 | 454 | 17,283 | 9,009,073 |
| POPULATION, SEX | ||||
| Male Map | 2,544 | 16,382 | 407,381 | 151,781,326 |
| Female Map | 2,421 | 15,583 | 406,799 | 156,964,212 |
| POPULATION, AGE (18 YEARS) | ||||
| 18 years and over Map | 3,735 | 25,927 | 611,383 | 234,564,071 |
| Under 18 years | 1,230 | 6,038 | 202,797 | 74,181,467 |
| POPULATION, AGE | ||||
| Under 5 years | 362 | 1,907 | 59,621 | 20,201,362 |
| 5 to 9 years | 328 | 1,697 | 55,531 | 20,348,657 |
| 10 to 14 years | 350 | 1,562 | 53,960 | 20,677,194 |
| 15 to 17 years | 190 | 872 | 33,685 | 12,954,254 |
| 18 and 19 years | 107 | 2,771 | 23,943 | 9,086,089 |
| 20 years | 48 | 1,768 | 11,907 | 4,519,129 |
| 21 years | 35 | 1,711 | 11,739 | 4,354,294 |
| 22 to 24 years | 143 | 2,879 | 33,950 | 12,712,576 |
| 25 to 29 years | 331 | 2,647 | 55,570 | 21,101,849 |
| 30 to 34 years | 310 | 1,774 | 49,859 | 19,962,099 |
| 35 to 39 years | 296 | 1,526 | 45,766 | 20,179,642 |
| 40 to 44 years | 309 | 1,469 | 47,346 | 20,890,964 |
| 45 to 49 years | 345 | 1,622 | 57,519 | 22,708,591 |
| 50 to 54 years | 417 | 1,736 | 59,399 | 22,298,125 |
| 55 to 59 years | 410 | 1,650 | 54,231 | 19,664,805 |
| 60 and 61 years | 128 | 502 | 18,999 | 7,113,727 |
| 62 to 64 years | 161 | 702 | 24,574 | 9,704,197 |
| 65 and 66 years | 96 | 370 | 13,621 | 5,319,902 |
| 67 to 69 years | 130 | 547 | 18,323 | 7,115,361 |
| 70 to 74 years | 183 | 698 | 25,683 | 9,278,166 |
| 75 to 79 years | 130 | 543 | 21,724 | 7,317,795 |
| 80 to 84 years | 75 | 465 | 18,004 | 5,743,327 |
| 85 years and over | 81 | 547 | 19,226 | 5,493,433 |
| MEDIAN AGE BY SEX | ||||
| Both sexes Map | 39.70 | 26.30 | 36.90 | 37.20 |
| Male Map | 39.30 | 25.90 | 35.60 | 35.80 |
| Female Map | 40.30 | 26.80 | 38.20 | 38.50 |
| HOUSEHOLDS | ||||
| Total Households Map | 2,017 | 12,029 | 322,282 | 116,716,292 |
| HOUSEHOLDS, HOUSEHOLD TYPE | ||||
| Family households: Map | 1,453 | 6,623 | 206,964 | 77,538,296 |
| Husband-wife family Map | 1,278 | 5,489 | 161,617 | 56,510,377 |
| Other family: Map | 175 | 1,134 | 45,347 | 21,027,919 |
| Male householder, no wife present Map | 72 | 399 | 14,233 | 5,777,570 |
| Female householder, no husband present Map | 103 | 735 | 31,114 | 15,250,349 |
| Nonfamily households: Map | 564 | 5,406 | 115,318 | 39,177,996 |
| Householder living alone Map | 461 | 3,557 | 94,638 | 31,204,909 |
| Householder not living alone Map | 103 | 1,849 | 20,680 | 7,973,087 |
| HOUSEHOLDS, HISPANIC OR LATINO ORIGIN OF HOUSEHOLDER | ||||
| Not Hispanic or Latino householder: Map | 1,996 | 11,876 | 316,719 | 103,254,926 |
| Hispanic or Latino householder: Map | 21 | 153 | 5,563 | 13,461,366 |
| HOUSEHOLDS, RACE OF HOUSEHOLDER | ||||
| Householder who is White alone | 1,989 | 11,351 | 292,219 | 89,754,352 |
| Householder who is Black or African American alone | 1 | 94 | 3,029 | 14,129,983 |
| Householder who is American Indian and Alaska Native alone | 10 | 96 | 18,966 | 939,707 |
| Householder who is Asian alone | 2 | 317 | 2,199 | 4,632,164 |
| Householder who is Native Hawaiian and Other Pacific Islander alone | 0 | 1 | 111 | 143,932 |
| Householder who is Some Other Race alone | 4 | 74 | 2,014 | 4,916,427 |
| Householder who is Two or More Races | 11 | 96 | 3,744 | 2,199,727 |
| HOUSEHOLDS, HOUSEHOLD TYPE BY HOUSEHOLD SIZE | ||||
| Family households: Map | 1,453 | 6,623 | 206,964 | 77,538,296 |
| 2-person household Map | 777 | 3,243 | 99,234 | 31,882,616 |
| 3-person household Map | 240 | 1,306 | 41,815 | 17,765,829 |
| 4-person household Map | 264 | 1,269 | 36,252 | 15,214,075 |
| 5-person household Map | 120 | 547 | 18,345 | 7,411,997 |
| 6-person household Map | 34 | 188 | 6,918 | 3,026,278 |
| 7-or-more-person household Map | 18 | 70 | 4,400 | 2,237,501 |
| Nonfamily households: Map | 564 | 5,406 | 115,318 | 39,177,996 |
| 1-person household Map | 461 | 3,557 | 94,638 | 31,204,909 |
| 2-person household Map | 83 | 1,081 | 16,441 | 6,360,012 |
| 3-person household Map | 15 | 470 | 2,758 | 992,156 |
| 4-person household Map | 3 | 199 | 1,019 | 411,171 |
| 5-person household Map | 2 | 55 | 303 | 126,634 |
| 6-person household Map | 0 | 35 | 95 | 48,421 |
| 7-or-more-person household Map | 0 | 9 | 64 | 34,693 |
| HOUSING UNITS | ||||
| Total Housing Units Map | 2,346 | 13,137 | 363,438 | 131,704,730 |
| HOUSING UNITS, OCCUPANCY STATUS | ||||
| Occupied Map | 2,017 | 12,029 | 322,282 | 116,716,292 |
| Vacant Map | 329 | 1,108 | 41,156 | 14,988,438 |
| HOUSING UNITS, OCCUPIED, TENURE | ||||
| Owned with a mortgage or a loan Map | 1,019 | 4,511 | 133,814 | 52,979,430 |
| Owned free and clear Map | 567 | 2,409 | 85,744 | 23,006,644 |
| Renter occupied Map | 431 | 5,109 | 102,724 | 40,730,218 |
| HOUSING UNITS, VACANT, VACANCY STATUS | ||||
| For rent Map | 29 | 367 | 10,366 | 4,137,567 |
| Rented, not occupied Map | 5 | 26 | 642 | 206,825 |
| For sale only Map | 24 | 147 | 3,696 | 1,896,796 |
| Sold, not occupied Map | 12 | 47 | 1,314 | 421,032 |
| For seasonal, recreational, or occasional use Map | 200 | 305 | 13,277 | 4,649,298 |
| For migrant workers Map | 2 | 3 | 88 | 24,161 |
| Other vacant Map | 57 | 213 | 11,773 | 3,652,759 |
| HOUSING UNITS, OCCUPIED, AVERAGE HOUSEHOLD SIZE BY TENURE | ||||
| Total: Map | 2.46 | 2.36 | 2.42 | 2.58 |
| Owner occupied Map | 2.57 | 2.56 | 2.53 | 2.65 |
| Renter occupied Map | 2.06 | 2.09 | 2.18 | 2.44 |
| HOUSING UNITS, OCCUPIED, TENURE BY RACE OF HOUSEHOLDER | ||||
| Owner occupied: Map | 1,586 | 6,920 | 219,558 | 75,986,074 |
| Householder who is White alone Map | 1,569 | 6,761 | 208,007 | 63,446,275 |
| Householder who is Black or African American alone Map | 0 | 13 | 747 | 6,261,464 |
| Householder who is American Indian and Alaska Native alone Map | 4 | 29 | 7,391 | 509,588 |
| Householder who is Asian alone Map | 1 | 71 | 958 | 2,688,861 |
| Householder who is Native Hawaiian and Other Pacific Islander alone Map | 0 | 0 | 50 | 61,911 |
| Householder who is Some Other Race alone Map | 4 | 15 | 753 | 1,975,817 |
| Householder who is Two or More Races Map | 8 | 31 | 1,652 | 1,042,158 |
| Renter occupied: Map | 431 | 5,109 | 102,724 | 40,730,218 |
| Householder who is White alone Map | 420 | 4,590 | 84,212 | 26,308,077 |
| Householder who is Black or African American alone Map | 1 | 81 | 2,282 | 7,868,519 |
| Householder who is American Indian and Alaska Native alone Map | 6 | 67 | 11,575 | 430,119 |
| Householder who is Asian alone Map | 1 | 246 | 1,241 | 1,943,303 |
| Householder who is Native Hawaiian and Other Pacific Islander alone Map | 0 | 1 | 61 | 82,021 |
| Householder who is Some Other Race alone Map | 0 | 59 | 1,261 | 2,940,610 |
| Householder who is Two or More Races Map | 3 | 65 | 2,092 | 1,157,569 |
| HOUSING UNITS, OCCUPIED, TENURE BY HISPANIC OR LATINO ORIGIN OF HOUSEHOLDER | ||||
| Owner occupied: Map | 1,586 | 6,920 | 219,558 | 75,986,074 |
| Not Hispanic or Latino householder Map | 1,580 | 6,891 | 217,277 | 69,617,625 |
| Hispanic or Latino householder Map | 6 | 29 | 2,281 | 6,368,449 |
| Renter occupied: Map | 431 | 5,109 | 102,724 | 40,730,218 |
| Not Hispanic or Latino householder Map | 416 | 4,985 | 99,442 | 33,637,301 |
| Hispanic or Latino householder Map | 15 | 124 | 3,282 | 7,092,917 |
| HOUSING UNITS, OCCUPIED, TENURE BY HOUSEHOLD SIZE | ||||
| Owner occupied: Map | 1,586 | 6,920 | 219,558 | 75,986,074 |
| 1-person household Map | 282 | 1,441 | 48,035 | 16,453,569 |
| 2-person household Map | 720 | 2,812 | 89,722 | 27,618,605 |
| 3-person household Map | 200 | 962 | 31,852 | 12,517,563 |
| 4-person household Map | 233 | 1,063 | 28,667 | 10,998,793 |
| 5-person household Map | 107 | 447 | 13,866 | 5,057,765 |
| 6-person household Map | 29 | 144 | 4,880 | 1,965,796 |
| 7-or-more-person household Map | 15 | 51 | 2,536 | 1,373,983 |
| Renter occupied: Map | 431 | 5,109 | 102,724 | 40,730,218 |
| 1-person household Map | 179 | 2,116 | 46,603 | 14,751,340 |
| 2-person household Map | 140 | 1,512 | 25,953 | 10,624,023 |
| 3-person household Map | 55 | 814 | 12,721 | 6,240,422 |
| 4-person household Map | 34 | 405 | 8,604 | 4,626,453 |
| 5-person household Map | 15 | 155 | 4,782 | 2,480,866 |
| 6-person household Map | 5 | 79 | 2,133 | 1,108,903 |
| 7-or-more-person household Map | 3 | 28 | 1,928 | 898,211 |
Loading...